
Observing the queue of people being checked out at a large grocery or retail store can be fascinating. You can see the shoppers deciding on which line to enter – based on the number of people, how many things are in their cart, how quickly the cashier is ringing up each sale, whether someone is assisting with bagging process, etc. Although most people don’t realize it, they are making an estimate on how long it will take for them to get through the checkout line by using a theory called “Little’s Law”.
This fundamental concept was developed over 50 years ago. It enables us to predict a specific process behavior and is named after John Little, a professor at MIT’s Sloan School of Management.
A simple visual that may be helpful in understand ing Little’s Law is an hour-glass. Generally, the last grains of sand will pass through the bottleneck about one hour after the first grains have passed. If you added twice the amount of sand, we could predict that it will take two hours for all the sand to pass from the top to the bottom.
The amount of sand in the glass represents the amount of things to be processed. The restricted area of the glass determines the rate at which sand can be processed. The length of time for the sand to flow from top to bottom is determined by how much we have to process divided by the rate that we can process it. Little’s Law is expressed in this equation:
Lead Time = Amount of Work-in-Process / Average Completion Rate
If you know two variables in the equation, you can calculate the third. If you reduce Work-in-Process (WIP) while maintaining the same Average Completion Rate (ACR), the Lead Time will be reduced. Conversely, if you can improve the process so that the ACR is increased while maintaining the same WIP, the Lead Time will be reduced.
Increasing ACR
Let’s go back to our shopper scenario. Suppose that a total of 60 people are waiting in line behind five open registers. With the current process, we see that 10 people are being checked out every 2 minutes. About how long would you expect for you to be checked out and exit the store?
(60 people) / (10 people every 2 minutes) = 18 minutes
Wow! I’m not sure I would want to wait in a line that long to buy groceries…but I’m sure all of us have been in these kind of queues before.
If you are the store manager, you can use this process understanding to look for short-term and longer-term process improvements. How could I lessen the waiting time immediately? I could increase the average completion rate (ACR) by opening up another register. Assuming the productivity of the extra register is the same as the others, the lead time will be reduced to 10 minutes. (If 5 people can be served every minute with five registers, then 6 people can be served every minute with six registers).
(60 people) / (12 people every 2 minutes) = 10 minutes
Longer term, we might look for ways to improve the process to increase the completion rate without adding people or capacity. Perhaps we could find a quicker way to stage and scan the items. Or could we stretch our thinking and find a way to eliminate the scanning process at the register – and instead have the customer scan the items and bag them as they shop?
Reducing WIP
The fundamental relationship between Lead Time and W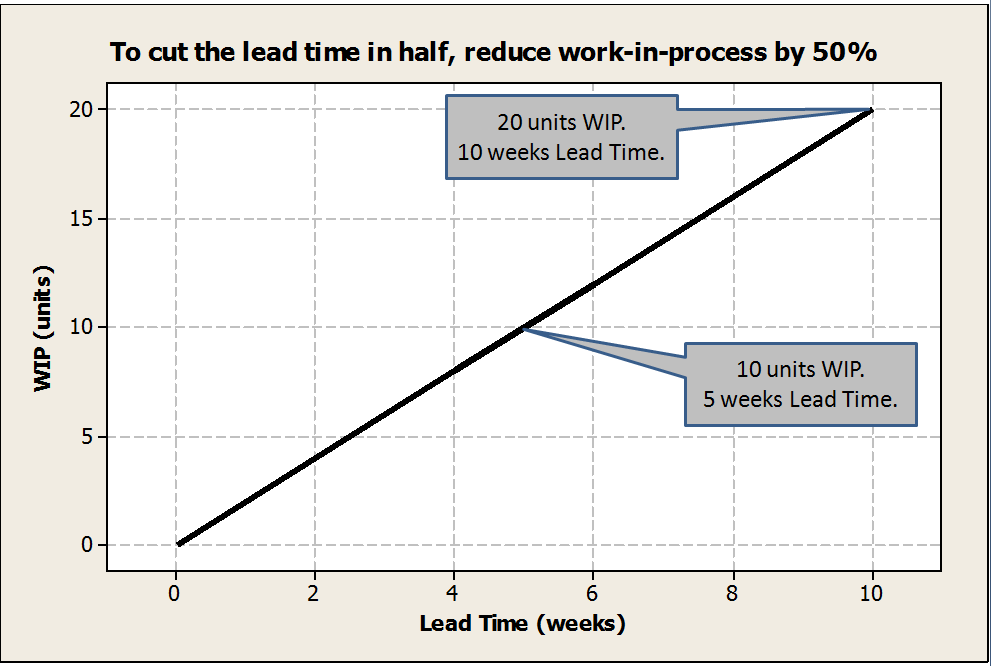 IP is depicted in this chart. Note that halving the amount of WIP will cut the lead time in half.
In a manufacturing setting, there are significant costs associated with having too much WIP (or any kind of inventory – it is one of the sources of waste)! Here is a mini case study of how WIP was reduced to decrease Lead Time.
A large manufacturing facility shipped large volumes of finished product via rail. The logistics group struggled to have the ‘right’ amount of rail cars on hand to service the facility. The average transit time for a rail car (from the time it was ordered until it arrived at the site) was 12 days. Because the facility never wanted to run out of empty rail cars, they almost always carried a surplus of empty cars on site. The price for carrying this excess inventory of cars was demurrage. (Demurrage is defined as charges for detaining a rail car beyond the time allowed for loading).
The goal was to cut the dwell time of the rail cars (how long they sat on the tracks before being loaded). If the dwell time could be reduced, the associated demurrage costs would also be less. The logistics group looked for a way to reduce the total number of cars (WIP) in the rail supply “loop”. The supply loop included all cars on site as well as all cars in transit.
Because of the long transit time for the rail cars, the logistics team needed a slightly more advanced tool than simply using Little’s Law equation. A kanban calculator was used to consider the following factors when ordering the number of cars to satisfy future needs.
- transit time
- usage
- safety stock
- replenishment time
- risk tolerance
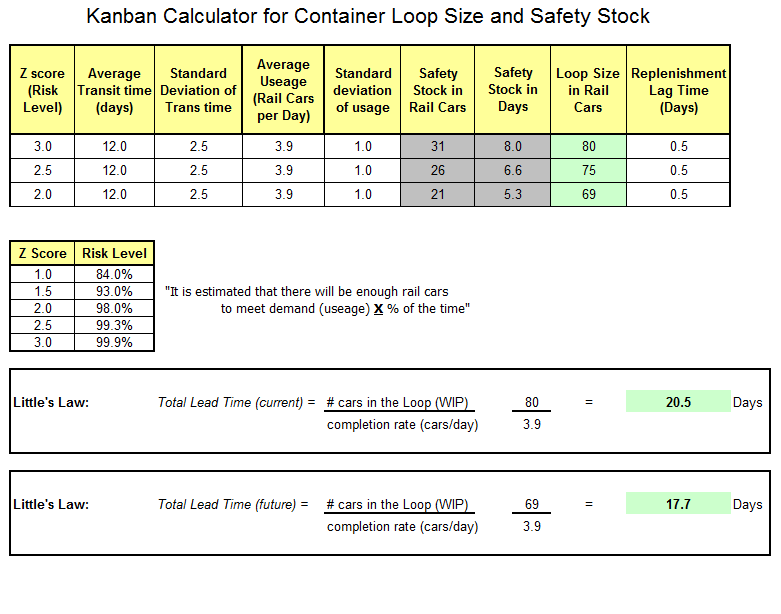
After modeling and validating the process, the team agreed to assume a slightly higher risk of not having enough rail cars to meet demand (from 0.1% to 2.0% ). This higher tolerance for risk allowed them to reduce WIP by 11 rail cars, which resulted in reducing the lead time by 3 days. Dwell time of empty cars on the tracks was reduced by an equal amount. The bottom line: this minor process change resulted in annual demurrage savings over $200k. The table below shows how a kanban calculator was used to find the loop size at various risk levels.
[gview file=”https://continuousmile.com/wp-content/uploads/2014/03/Kanban-calculator-for-Pulp-Rail-Cars-Littles-Law-Example.xls”]
A law for everyone
The principle of Little’s Law can be applied to any process. This includes the transactional parts of any business. Consider using this concept to better manage projects, answer customer requests, or even increase your personal productivity.
After all, most of us can use a “Little” help now and then!